
Divvy Bike Sharing
Jifu Zhao, 26 February 2018

Chicago Divvy Bicycle Sharing Data Visualization and Analysis
Divvy is a bicycle sharing system in the City of Chicago and two adjacent suburbs operated by Motivate for the Chicago Department of Transportation. It operates 5800 bicycles at 580 stations in an area bounded by 87th Street on the south, Central Street in Evanston on the north, Rainbow Beach Park near South Shore Drive on the east, and Harlem Avenue in Oak Park on the west (from Wikipedia). Since the data is related to people’s daily life, exploring it can help us find some interesting phenomena.
In this blog, I conduct a series data processing and visualization, all the source code can be find in my GitHub page: https://github.com/JifuZhao/Chicago_Divvy. The original data I used and processed can be found in Kaggle Dataset: https://www.kaggle.com/yingwurenjian/chicago-divvy-bicycle-sharing-data. If you are interested, you can download and explore it.
Data
Bicycle Data: Divvy System Data
You can download the bicycle sharing data from 2013 to 2017. The original data includes:
- Trip start day and time
- Trip end day and time
- Trip start station
- Trip end station
- Rider type (Member, Single Ride, and Explore Pass)
- If a Member trip, it will also include Member’s gender and year of birth
Weather Data: Wunderground.com
Wunderground is a website you can query the weather information for free. It contains various weather information for the given area.
Processing
For this project, I download all the bicycle data and query the weather information from Wunderground.com from 2013 to 2017. After initial exploration, I only use the data from 2014 to 2017. I delete the data with missing values and only use the data that have trip duration from 2 minutes to 1 hour. For the weather information, I only keep the temperature and events.
Visualization
After cleaning the data, I conduct a series of data visualization.
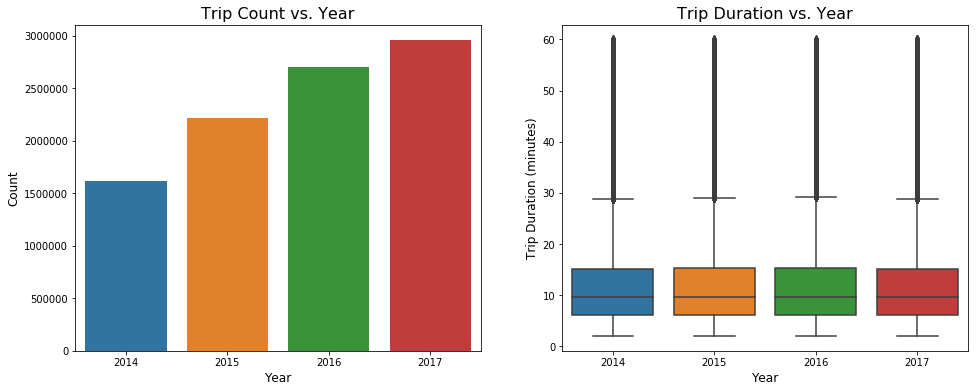
Trip Distribution vs. Year
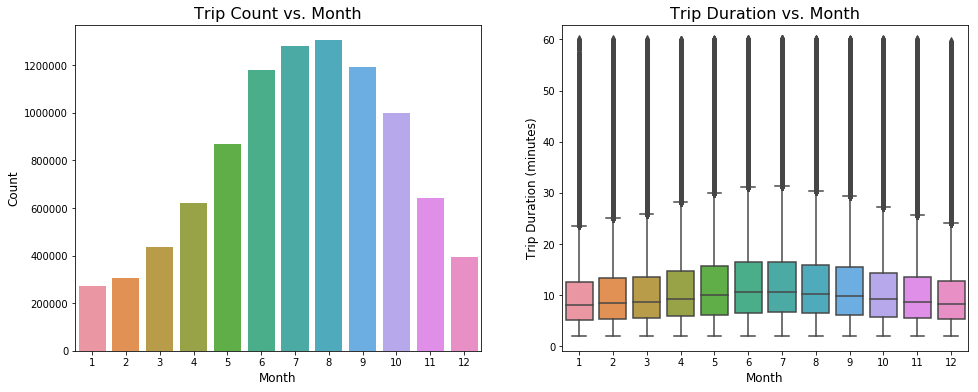
Trip Distribution vs. Month
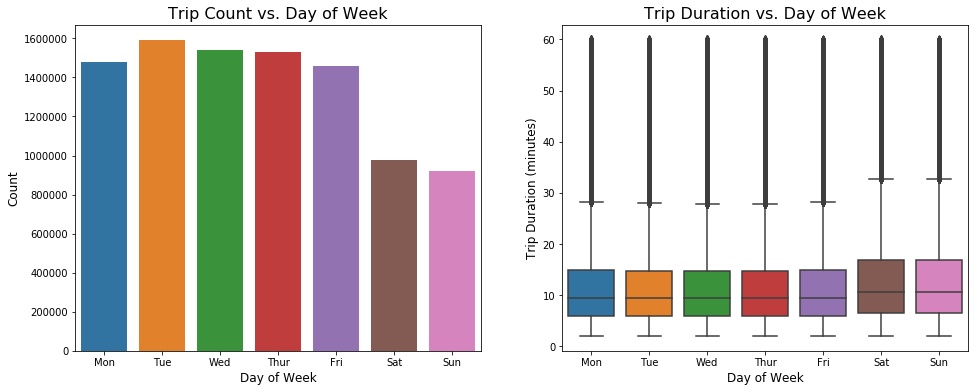
Trip Distribution vs. Day of Week
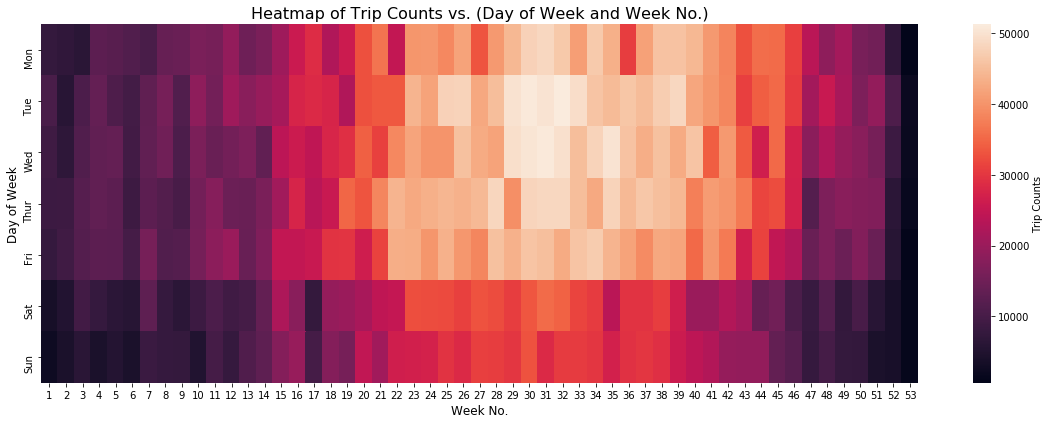
Heat map of Trip Counts vs. Day of Week and Week No.
Trip Distribution vs. Hour
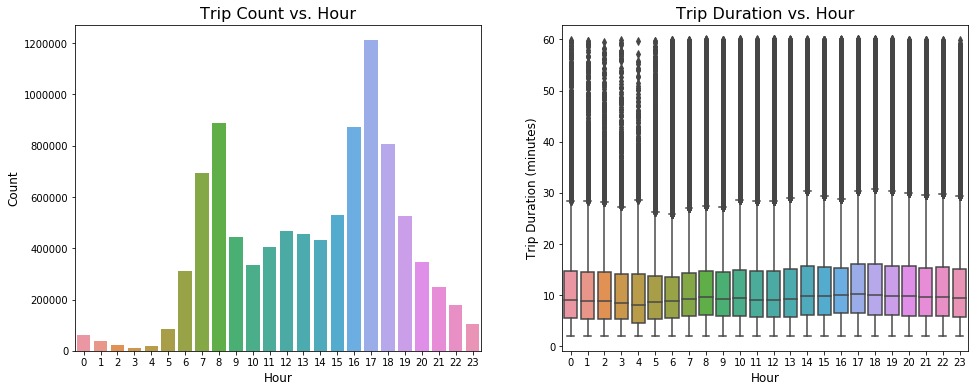
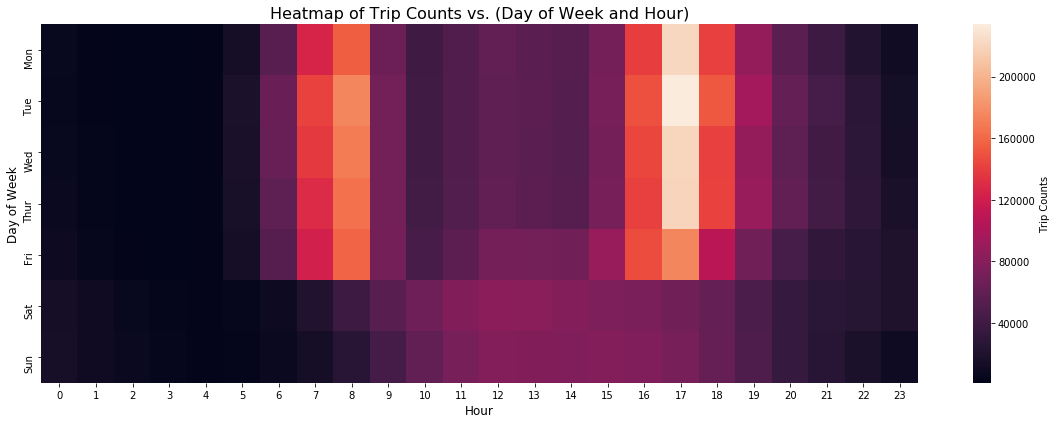
Heat map of Trip Counts vs. Day of Week and Hour
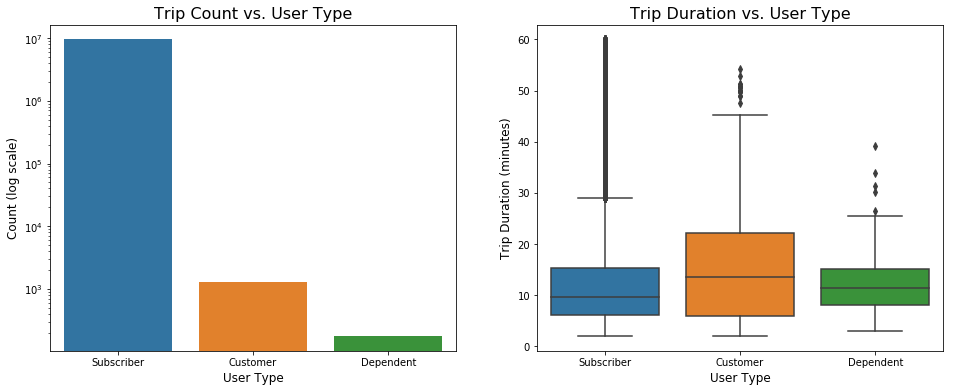
Trip Distribution vs. Customer Category
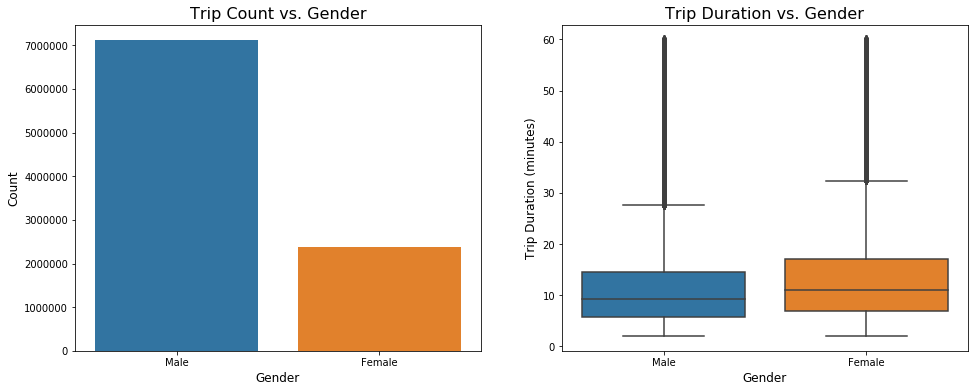
Trip Distribution vs. Gender
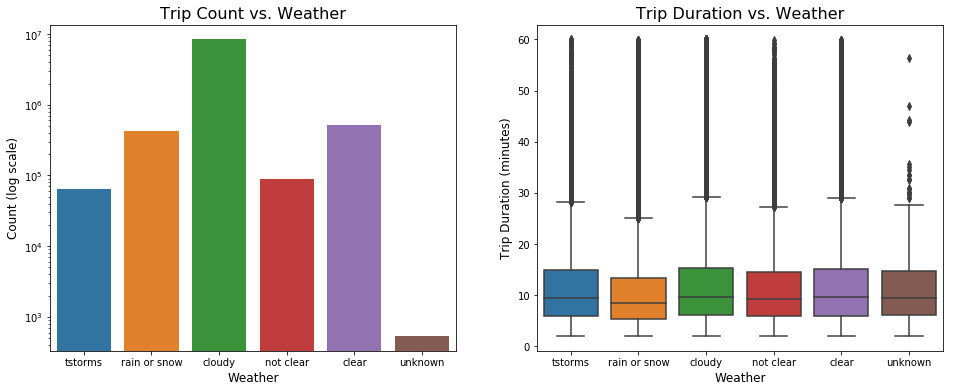
Trip Distribution vs. Weather
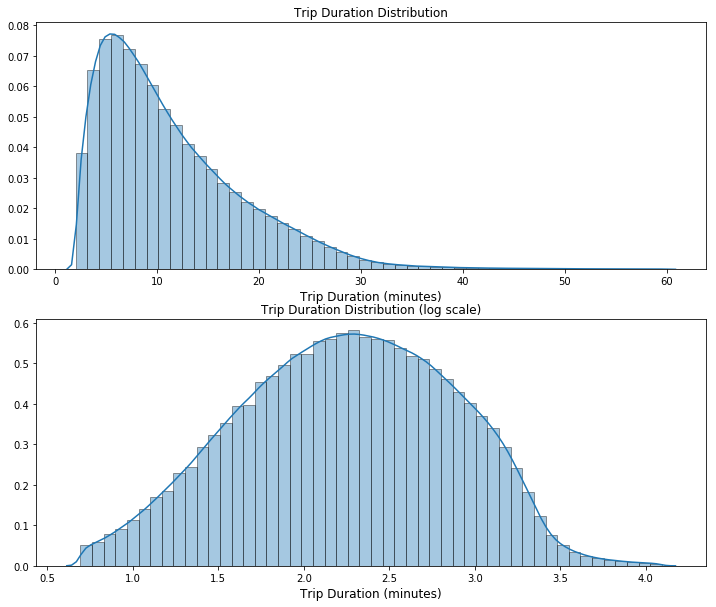
Trip Duration Distribution
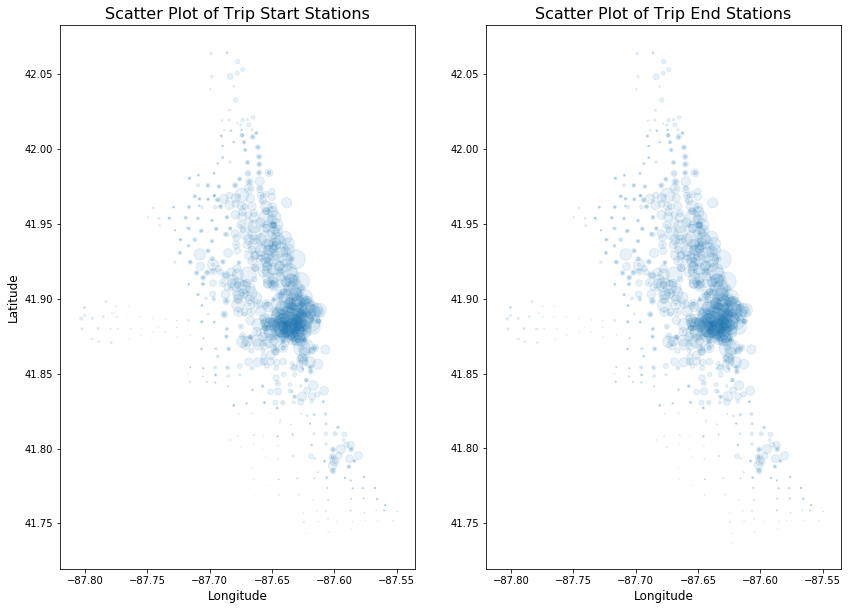
Scatter Plot of Trip Start Stations and End Stations
Conclusion
Through above visualization figures, I have noticed several interesting phenomena.
- From 2014 to 2017, there are increasing demand for sharing bicycles. Since the population of Chicago is relative constant, we can assume that people tend to live healthier as time goes on.
- People use sharing bicycles more in summer than winter (more frequently usage and longer trip duration)
- People use sharing bicycle more frequently in weekdays than weekends, but the average trip duration is longer in weekends than weekdays.
- During rush hours (~8:00 am and ~5:00 pm), there are increasing demand for sharing bicycles during weekdays, but on weekends, there is no such clear trend.
- Most users purchased the Annual Membership. But their trip durations are relatively shorter compared with ordinary customers and dependent. Those who purchased 24-hour pass tend to have longest trip.
- Male users use sharing bicycle more often than female users, but female users have longer trips.
- Most trips are within 15 minutes.
- Most usage is in downtown Chicago. There are some stations rarely used.
What’s Next ?
Divvy bicycle sharing system represents on kind of bicycle system: they have fixed stations. In addition to Divvy, recently, there is another kind of station-free system that is very popular in some countries, for example ofo and Mobike system in China. It would be interesting if there is some comparison among these two system. Below I only listed some points I can think about.
| Chicago Divvy Bicycle | China ofo / Mobike Bicycle |
|---|---|
| Fixed stations | Station-less |
| Easy to manage | Hard to manage |
| Easy to track | Hard to track single user |
| High cost | Low cost |
| And so on | And so on |
So, what your point? Feel free to contact if you find any problems.